Amazon Inventory Forecasting: Scaling Without Cash Flow Disasters
A brand doing $80,000 per month in revenue with a 75-day lead time needs roughly $100,000 in inventory on hand or in transit at any given moment. That number surprises most growing sellers the first time they run the math. And it only goes up as sales accelerate.
Amazon inventory forecasting is one of those operational challenges where mistakes compound faster than correct decisions pay off. Stock out, and you lose organic ranking, advertising momentum, and sales that took months to build. Overstock, and Amazon's aged inventory surcharges escalate on a tiered schedule starting at the 181-day mark, and the jumps get steep fast. For brands approaching seven figures annually, every purchase order represents a meaningful bet on future demand. Gut-feel ordering based on last month's sales isn't a strategy at that level.
This article breaks down the real costs on both sides of the inventory equation, how Amazon's fee structure penalizes mistakes, and how to build a forecasting approach that scales with your business without strangling cash flow.
What Stockouts Actually Cost You
Running out of stock means lost sales for however long you're unavailable. That part is straightforward. What catches many sellers off guard is everything that breaks afterward.
When a product goes out of stock, Amazon's search algorithm starts deprioritizing it within 48 hours. The algorithm rewards consistent sales velocity, and a stockout resets that momentum. We've seen brands take 2 to 4 weeks to recover their previous organic ranking after even a 5-day stockout, and some never fully recover if competitors captured those customers during the gap.
Ranking is just the visible damage. If you're running Sponsored Products or Sponsored Brands campaigns, those ads stop serving the moment inventory hits zero. When you restock, you're rebuilding campaign history and relevance from a weaker position. The advertising spend required to recapture your previous performance can exceed the revenue lost during the stockout itself.
Ranking is just the visible damage; what follows is harder to see and slower to fix. Lower ranking after restocking means lower organic sales velocity, which drags down your sell-through rate, which impacts your Inventory Performance Index (IPI) score. A lower IPI can trigger storage limits from Amazon, making it harder to send in enough inventory to prevent the next stockout. One bad inventory call creates a chain reaction that can take months to fully unwind.
For brands with seasonal products, the math is even less forgiving. A stockout during Q4 peak season means lost revenue you simply cannot recover. The demand window closes whether you're in stock or not.
Amazon's Fee Clock Starts Earlier Than You Think
Carrying too much inventory creates a different kind of problem, and the penalties kick in sooner than many sellers realize.
Monthly storage fees for standard-size products run $0.78 per cubic foot from January through September, then jump to $2.40 per cubic foot during Q4. Those are the baseline costs most sellers account for. The real margin erosion comes from aged inventory surcharges that Amazon applies to anything sitting in fulfillment centers longer than 180 days.
The surcharge tiers for standard-size items escalate quickly:
- 181 to 210 days: $0.50 per cubic foot
- 211 to 240 days: $1.00 per cubic foot
- 241 to 270 days: $1.50 per cubic foot
- 271 to 300 days: $5.45 per cubic foot
- 301 to 330 days: $5.70 per cubic foot
- 331 to 365 days: $5.90 per cubic foot
- 366 to 455 days: $6.90 per cubic foot or $0.15 per unit, whichever is greater
- 456+: $7.9 per cubic foot or $0.35 per unit, whichever is greater
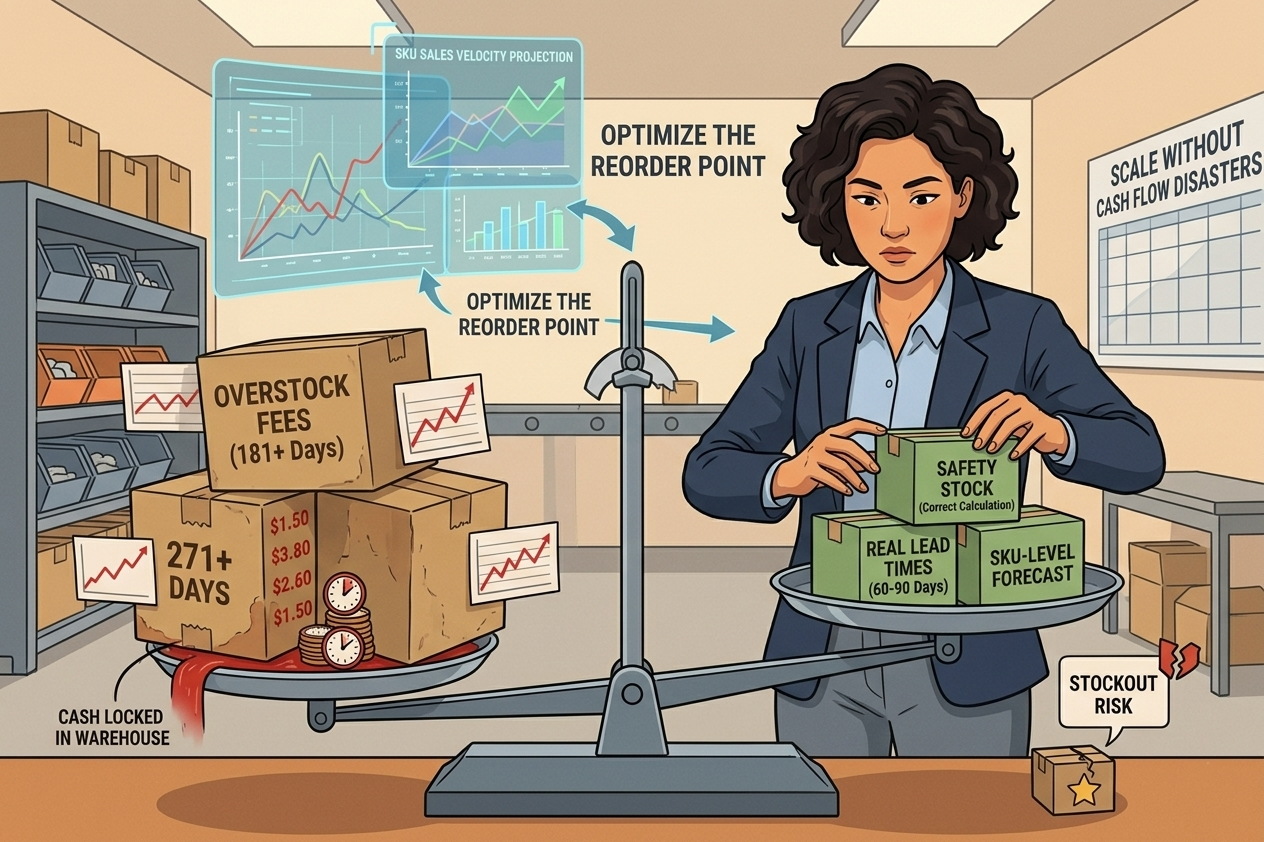
That jump at 271 days is where most brands feel the pain. The surcharge more than doubles overnight, from $1.50 to $3.80 per cubic foot, and these charges stack on top of your regular monthly storage fees.
Your IPI score factors into this equation directly. Amazon calculates IPI based on excess inventory, sell-through rate, stranded inventory, and in-stock rate. Fall below the 400 threshold and Amazon restricts how much inventory you can send in while potentially adding storage utilization surcharges. The result is pressure from both directions: not enough inventory triggers stockouts, too much triggers escalating fees. Accurate forecasting is how you navigate the space between those two failure modes.
Building an Inventory Forecasting System That Scales
Checking last month's sales and multiplying by lead time works when you're moving 10 units a day with flat demand. It breaks when seasonality, promotions, or growth trends enter the picture.
Forecast at the SKU level, not the account level. Aggregate numbers mask the reality that some products sell at 3x the rate of others with completely different seasonal patterns. Account-level forecasting leads to overstocking slow movers while your best sellers run dry. We've seen this pattern repeatedly with brands managing 50 or more active SKUs.
Use your actual lead time, not the quoted one. A manufacturer may quote 4 weeks, but factor in production variability, freight transit, customs (if importing), and Amazon's inbound receiving process, and the real number often lands between 60 and 90 days. We've seen brands consistently underestimate true lead time by 3 to 4 weeks. That gap is exactly where stockouts happen.
Calculate safety stock based on demand variability, not a flat percentage. A product that sells 15 units one day and 45 the next requires a different buffer than one that consistently moves 25 to 30. For most growing brands, 15 to 30 days of safety stock provides reasonable coverage without tying up excessive capital. Adjust higher for products with unpredictable demand or long lead times.
Forecasting cadence matters too. Monthly reviews work for stable product lines, but brands running promotions or growing above 15% quarter over quarter need weekly updates to catch shifts before they become problems.
A practical approach that works well: set reorder points for each SKU based on true lead time plus safety stock, then revisit those thresholds monthly as your data set deepens. After 6 to 12 months of solid data, forecasts get meaningfully more accurate and you can tighten safety stock without increasing risk.
Why Inventory Forecasting Becomes a Cash Flow Problem
For brands in the mid-six-figure to seven-figure range, Amazon inventory forecasting stops being purely a logistics exercise and becomes a cash flow management challenge. The math creates tension that doesn't resolve easily.
Take a brand doing $80,000 per month with 35% cost of goods. That's $28,000 per month in inventory cost. With a 75-day lead time and 30 days of safety stock, you need roughly 3.5 months of inventory on hand or in transit at any point. That's close to $100,000 tied up in product before accounting for advertising, freight, or operating expenses.
Now layer growth on top. If sales increase 15% quarter over quarter, your inventory investment needs to increase at the same rate. But the cash from those incremental sales doesn't land for 2 to 4 weeks after the sale, depending on Amazon's payment cycle and your sell-through timing. Growing brands frequently find themselves profitable on paper but cash-tight in practice because the capital is sitting in cardboard boxes at Amazon warehouses.
This cash pressure is where the most expensive forecasting mistakes happen. Brands cut purchase orders to preserve cash flow, reducing safety stock during a growth phase. That nearly guarantees stockouts, which trigger the ranking loss and advertising recovery costs that make the cash problem worse.
A few approaches help manage this tension:
Stagger purchase orders rather than placing one large order per cycle. Smaller, more frequent orders reduce the cash committed at any single point, even if per-unit costs run slightly higher. For most brands, the trade-off is worth the flexibility.
Push for supplier payment terms. Moving from prepayment to net-30 or net-60 aligns your cash outflows closer to when Amazon actually pays you. This is free financing that many brands don't think to negotiate.
Prioritize inventory by velocity. Your top 20% of SKUs likely generate the majority of revenue. Those get priority allocation. Slower-moving products get tighter safety stock and more conservative reorder quantities. Not every SKU deserves equal investment.
The brands that scale without cash flow crises consistently treat inventory planning as a financial exercise, not just a supply chain one.
Scaling Forecasting Without Scaling Problems
Amazon inventory forecasting isn't glamorous, but it's one of the highest-leverage operational decisions growing brands make. The gap between a brand that scales to seven figures profitably and one that grows into a cash crunch usually comes down to how well they balance stockout risk against overstock costs.
The framework doesn't have to be complicated. Start with accurate lead times, build in realistic safety stock, forecast at the SKU level, and review consistently. As your data set grows, your accuracy improves. And as accuracy improves, you can run leaner inventory and free up cash for the things that actually drive growth.
The complexity does scale with the business though. A brand with 15 SKUs and steady demand can manage this in a spreadsheet. A brand with 150 SKUs, seasonal demand shifts, and multiple international suppliers needs a more structured approach, whether that's dedicated forecasting software, experienced operational support, or both.
If inventory has become more of a recurring headache than a managed process, or if stockouts and storage fees have turned into regular line items, reach out for a free evaluation. We'll look at your current inventory health, identify the biggest gaps, and give you an honest read on whether the situation warrants outside help. If it doesn't, we'll point you in a direction that makes more sense.
Recent Posts